WHY YOU NEED A MODEL OF YOUR NETWORK
Model-driven monitoring can provide you with a comprehensive understanding of your electrical network and how it functions under different conditions. This allows you to make informed decisions when integrating solutions for design, simulation, analysis, optimization, monitoring, operation, and automation. In addition, it can be used to calculate incident energy levels ensuring your compliance with arc flash and safety standards.
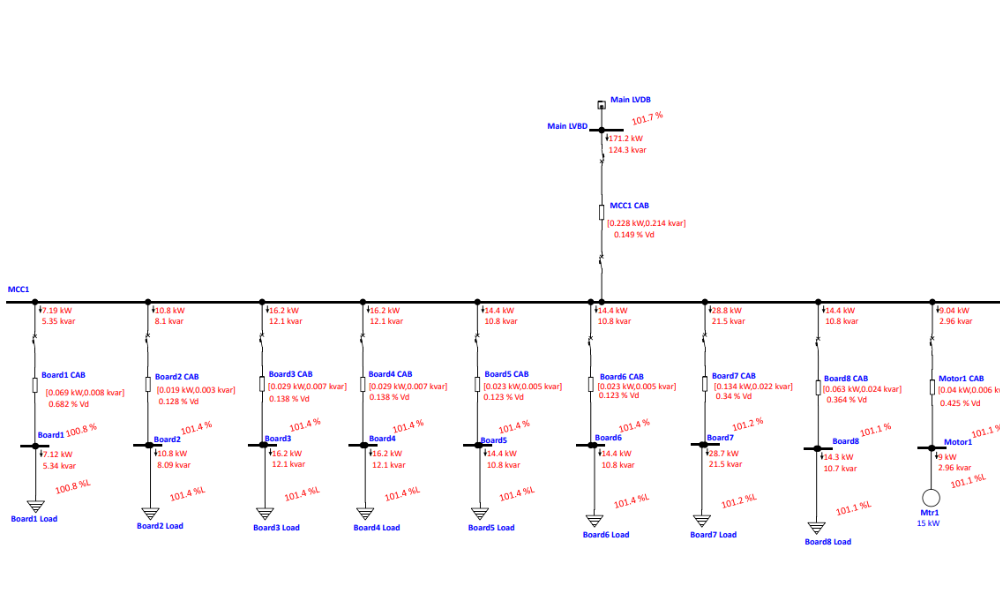
Typically when we are asked to conduct an arc flash study we begin by developing a model of your entire electrical network starting at the utility, and working through to MCCs and distribution boards including transformers, generators, motors, UPS, cables, and any other sources of power. We then take this information and subject the model to any amount of simulations of different operational scenarios to see how the system will react and how it impacts the incident energy levels.
- The introduction of renewable energy sources
- Adding battery energy storage
- Expansion of the site
- Use of energy sources like generators and CHPs.
- Any coupling that can be performed.
- Or any combination of multiple energy sources and coupling scenarios.
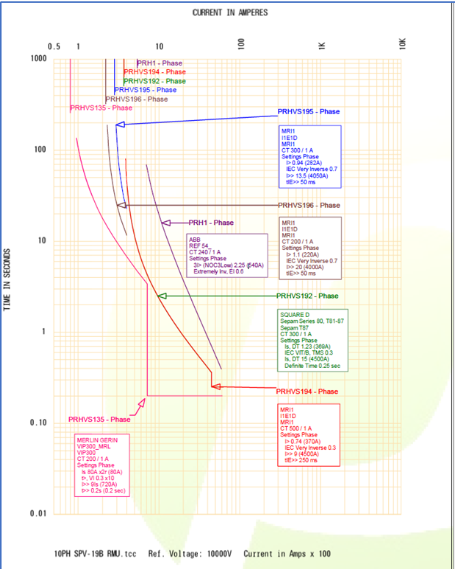
Each can have a profound impact on the arc flash levels which can be seen in the graphs below.
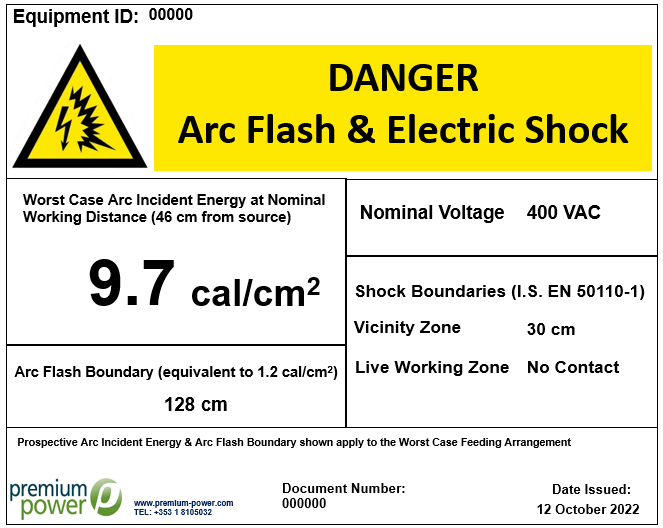
Generally, the end product of all this study is the placing of labels on electrical equipment throughout the site to inform employees of the possible dangers.
Scenario Examples
The graph below shows a single MV and LV location in a network containing a wind turbine, embedded generation, and coupling, with its resulting incident energy levels in all the different operating scenarios. You can see that it changes depending on the scenario.
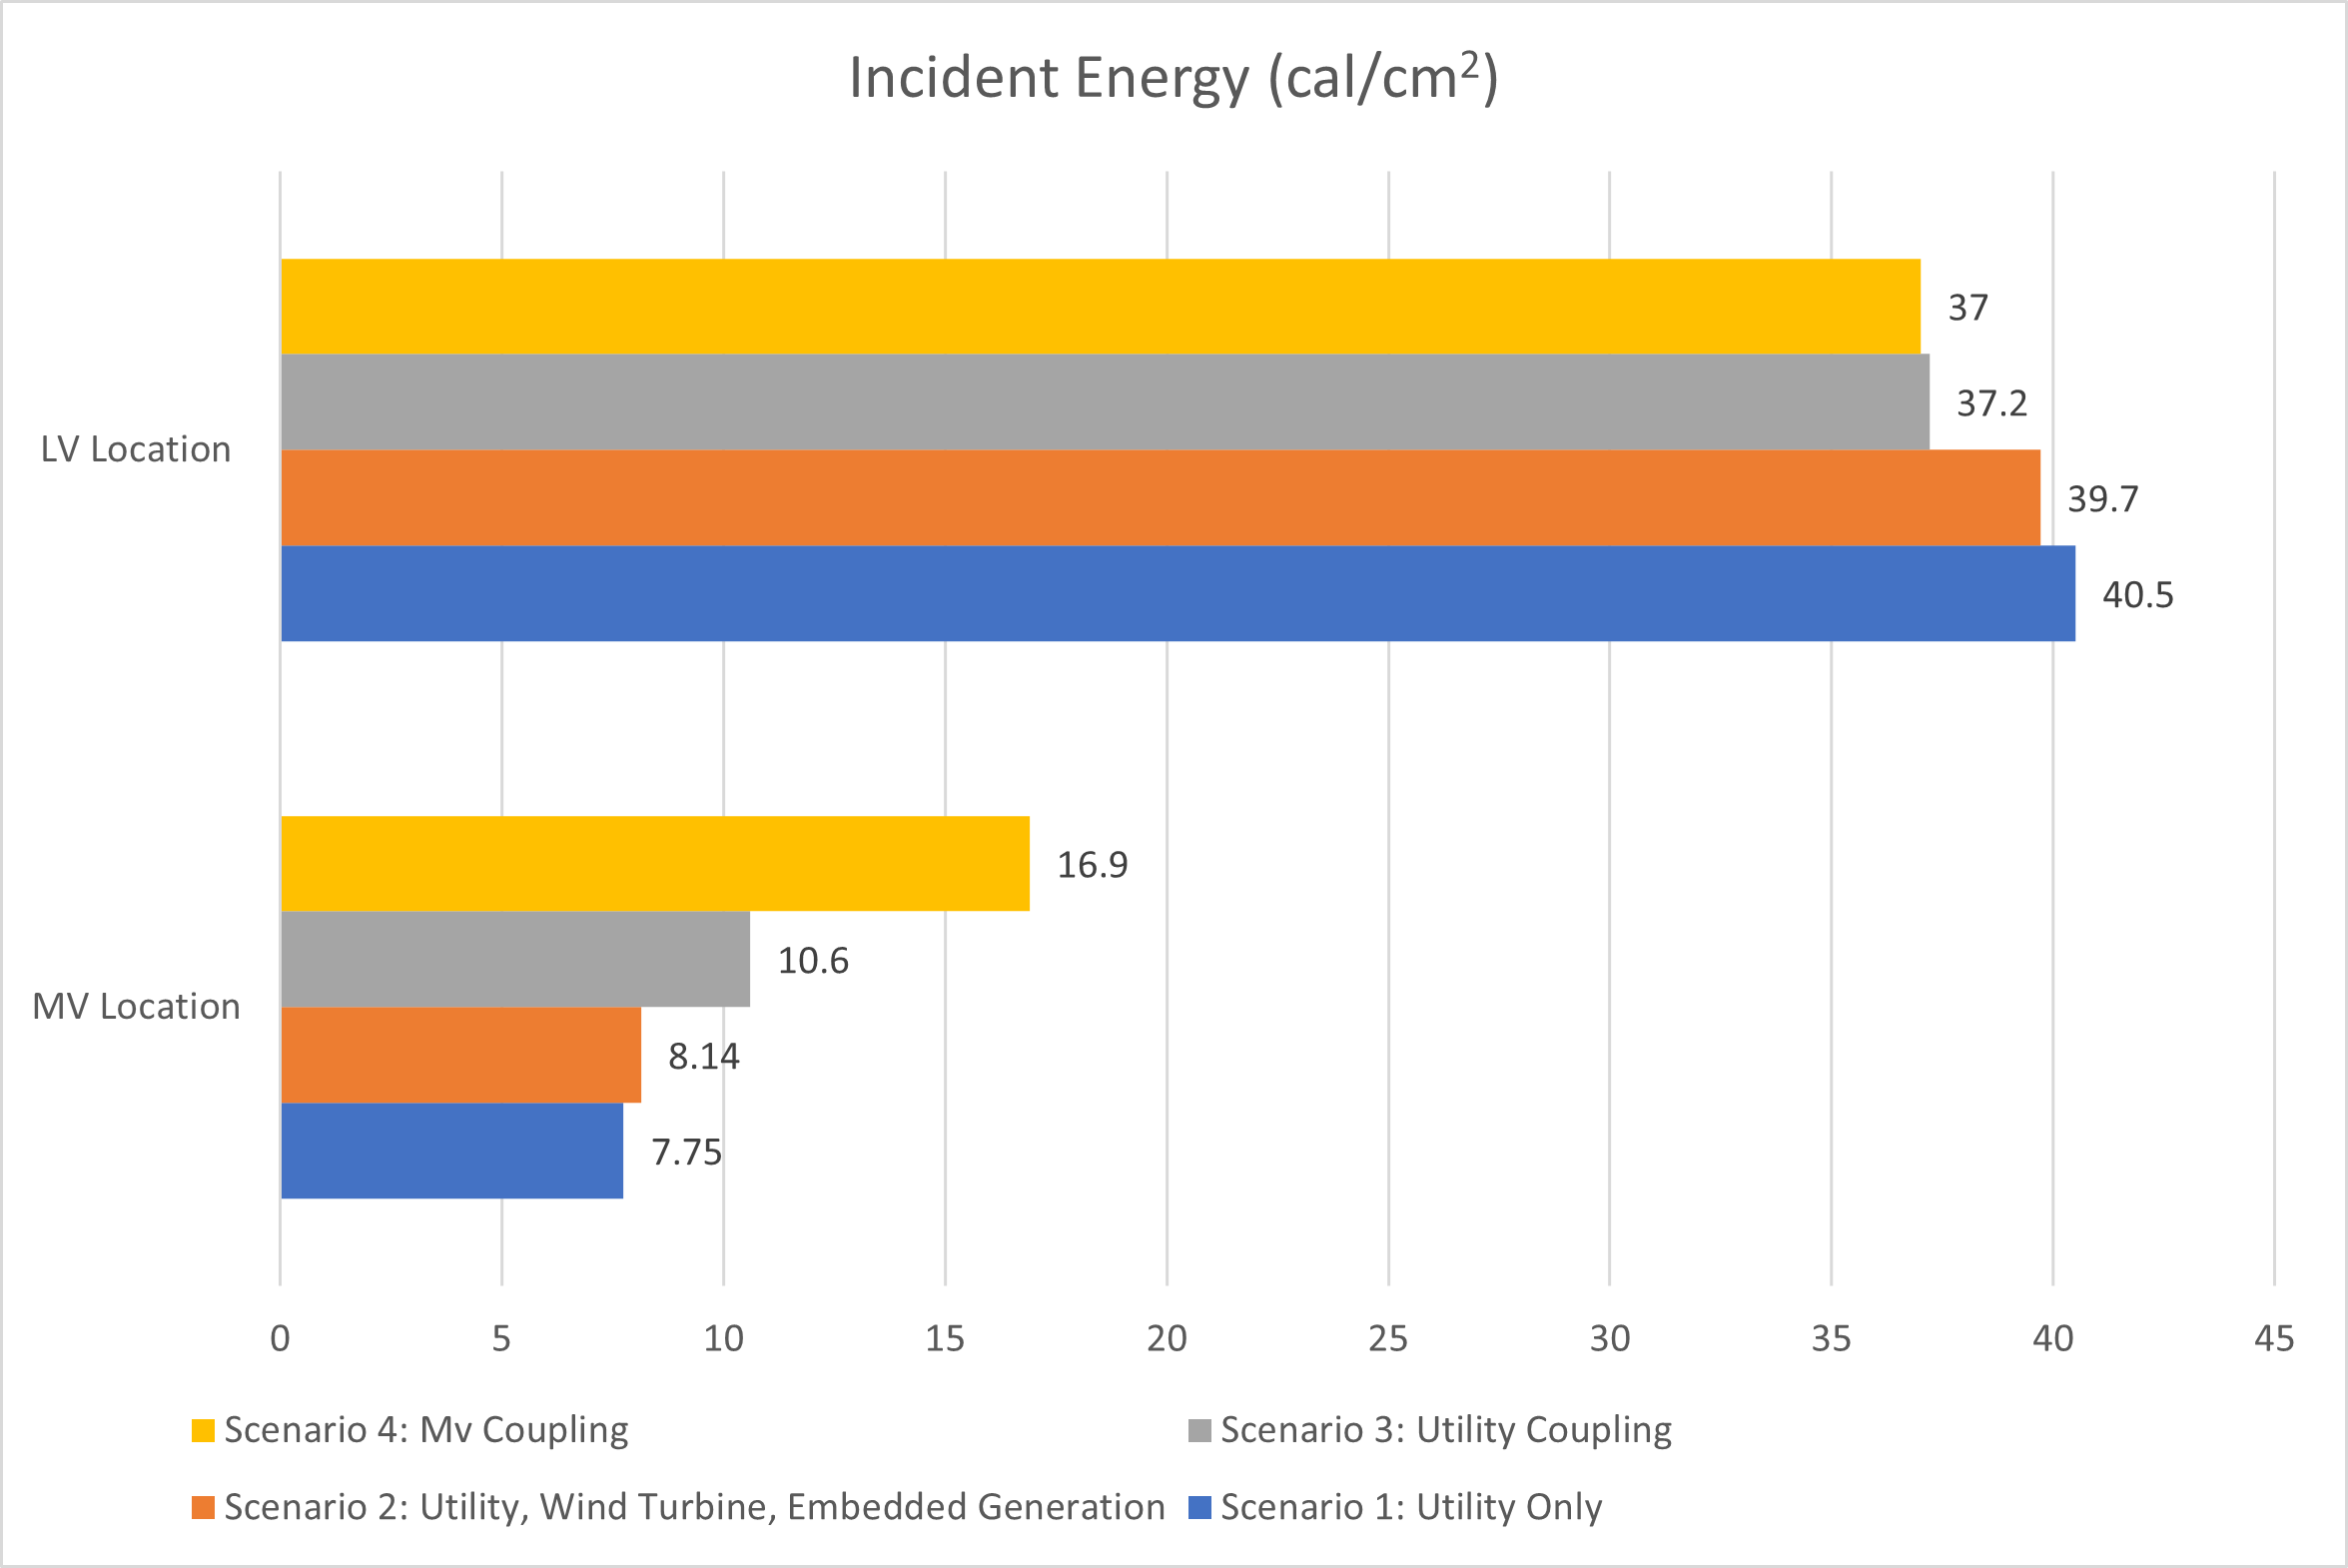
If we look at the graph when we consider a downstream LV location. The incident energy levels do not proportionally increase or decrease throughout the network. Depending on the location and the scenario the incident energy changes so assumptions for the worst case scenario for all locations can not be made. Any addition to your network, be it a generator, a renewable source, or a battery energy storage system should be incorporated into a model and its effect analyzed before installation so a safe working environment can be maintained under all conditions.
Network Expansion
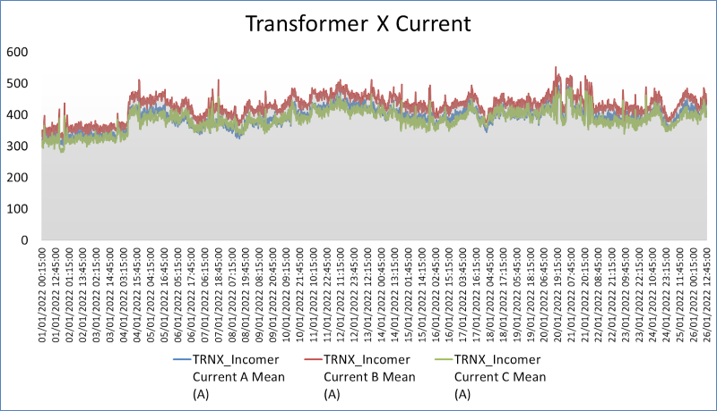
The same applies to network changes or expansion plans where new systems or technologies get added. Using a power monitoring system or adding a portable meter to the connection point we can analyze whether a proposed expansion is feasible using the load data, as can be seen in the below graph, together with the cable, transformer capacity, and protection settings.
If you would like to discuss the possibility of getting your electrical network modeled, please contact us below, or request a callback from one of our engineers who can talk you through the entire process.